- DATE:
- AUTHOR:
- S&P Global
March 2026 S&P Capital IQ Release Notes
S&P Capital IQ Release Highlights
In this release, we added new enhancements on Capital IQ to improve your daily workflows:
Portfolio Analytics: Introduced group-level what-if analysis, enhanced folder management, and new MSCI classifications, enabling users to quickly test allocation changes, stay organized as usage scales, and gain deeper geographic and market-level insights.
Credit Risk Pricing: Enhanced GSAC v3-centered interface streamlines transfer pricing analysis with unified inputs and outputs, dynamic parameter selection, and seamless access to current and historical methodologies, delivering greater structure and consistency.
S&P Capital IQ Plug-In: EWS 1.0 in the S&P Capital IQ Plug-In introduces early warning signals to alert users of a company’s declining risk level.
Portfolio Analytics
In this release, we expanded Portfolio Analytics with ‘group-level what-if analysis’, enhanced folder management, and new MSCI classifications. These updates help users quickly test allocation changes, stay organized as usage scales, and gain deeper geographic and market-level insights.
Group-Level What-If Analysis
Users can now perform ‘what-if analysis’ at the grouping level – such as sector, industry, or region – in addition to adjusting individual holdings. This enables faster evaluation of allocation changes, while preserving total portfolio market value.
Key Capabilities:
Run what-if analysis by adjusting group-level portfolio weights
Rebalance allocations across groups while keeping total portfolio value unchanged
Automatically reflect group-level changes in the underlying holdings
Compare adjusted portfolios to the original to evaluate the impact on performance and portfolio characteristics
Find it in the platform:
Navigate to the Portfolios tab from the top navigation
Go to the Reports tab, open a report and click the dropdown arrow next to the report name
Select Adjusted Portfolio Comparison
Choose By Groupings and select a grouping (e.g., GICS Sector, Industry, Region)
Adjust group-level portfolio weights; benchmark weights are displayed for reference
Click Update to view results
Optionally, Save the adjusted portfolios for continued analysis


Enhanced Folder Management
Users can access enhanced folder functionality to efficiently organize reports, layouts, and schedules – especially when managing many saved items.
Find it in the platform:
Navigate to the Portfolios tab from the top navigation
Go to Reports, Layouts, or Scheduled Reports
Click Edit, enable Select Multiple and select items using checkboxes
Choose Actions > Move to Folder
Move multiple reports, layouts, or schedules at once using multi-select
Organize Schedules into subfolders (e.g., Daily, Monthly, Quarterly, or by portfolio)
Simplify cleanup and reorganization without deleting saved artifacts
To return an item to its default location, select Reset Folder
When deleting a folder, choose the option to reset contained items instead of deleting them


MSCI Classifications
New MSCI classifications are now available for users as metrics or groupings in Portfolio Analytics reports, enabling richer geographic and market-level analysis.
New classifications available:
MSCI Geo Region Code: Analyze portfolios by major geographic regions such as Americas, EMEA, and APAC
MSCI Market: Classify holdings by market development level, including Developed, Emerging, and Frontier Markets
Find it in the platform:
Navigate to the Portfolios tab from the top navigation
Go to the Reports tab and open or create a report
Use the Grouping or Metrics menus
Select the desired MSCI classification
Note: Access to MSCI data requires an additional subscription, please contact your account team for details.
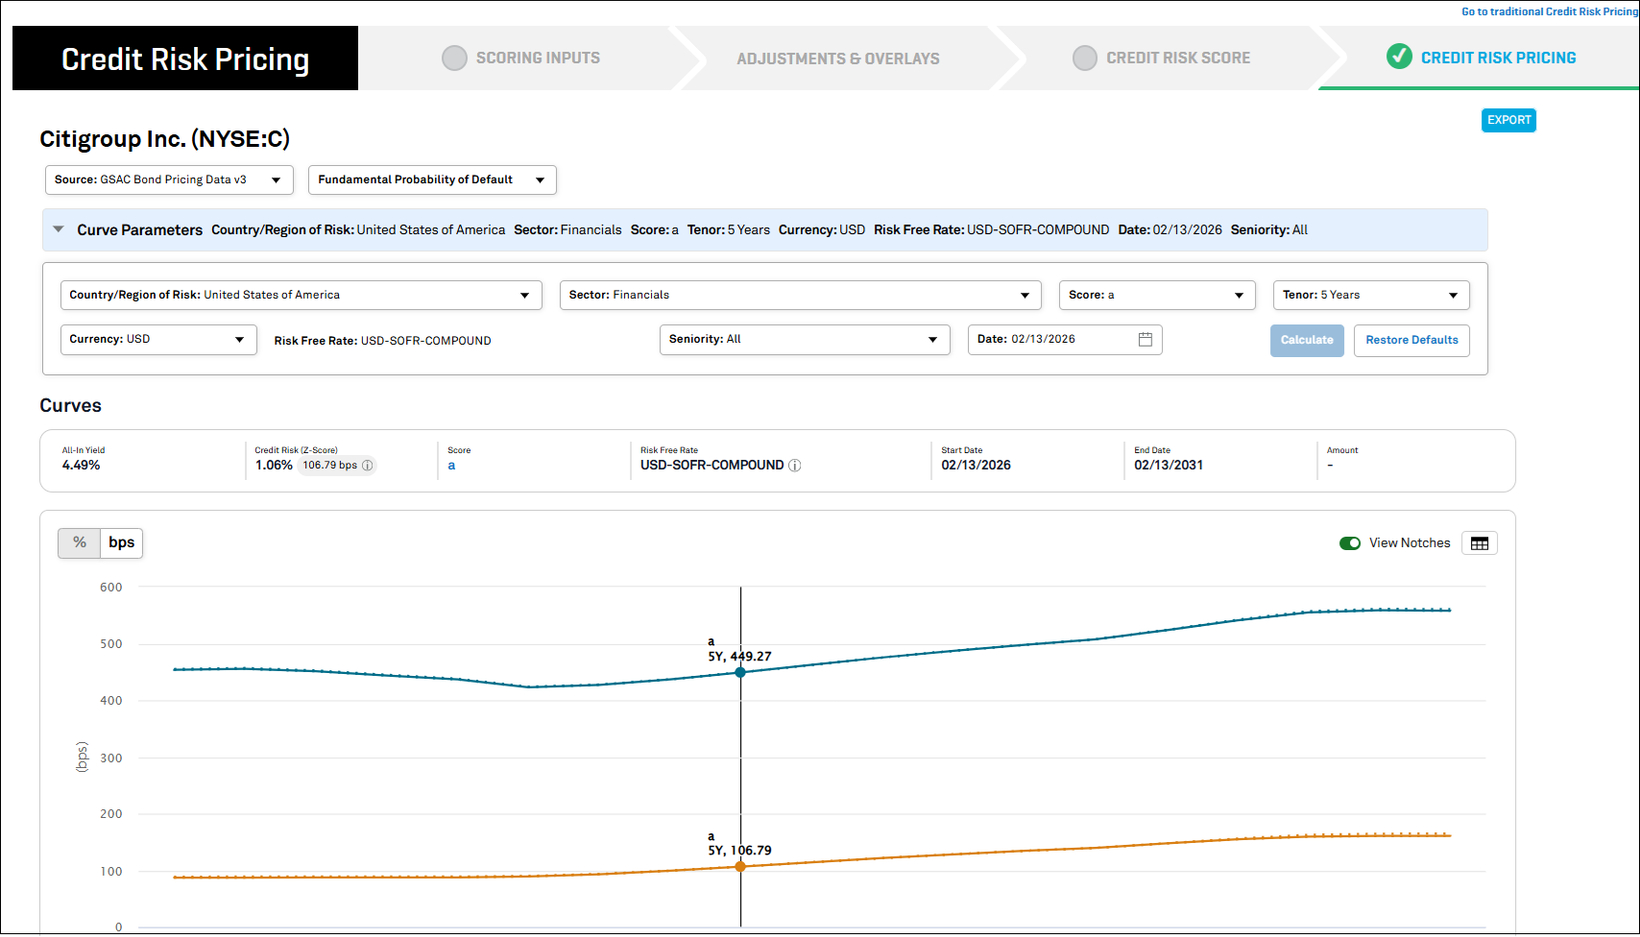
Credit Risk Pricing
In this release, we advanced Credit Risk Pricing to a GSAC v3-centered experience that brings greater structure, consistency, and discipline to transfer pricing analysis. A unified pricing interface presents inputs, outputs, and core measures on a single analytical surface, with parameter selection dynamically reflecting underlying curve coverage. The workflow supports immediate access to pricing and preserves access to established methodologies, ensuring continuity across both forward‑looking and historical analyses.
Consistent and Disciplined Credit Risk Pricing with GSAC v3
We enhanced the Credit Risk Pricing experience on the desktop, centered around GSAC v3. Pricing inputs, outputs, and visualizations are presented within a unified, structured layout for clearer configuration and interpretation of results. Risk‑free rates are represented consistently across currencies, and key pricing measures, including All‑in Yield and Z‑spread, are displayed in a consolidated view.
The workflow supports direct access to Credit Risk Pricing when applicable, while preserving the full scoring path for comprehensive analyses. Parameter selection dynamically reflects GSAC v3 curve coverage, guiding users toward supported sector, geography, and currency combinations.
Find it in the platform:
Search for and select a company in the top search
On the company’s profile, select Credit Risk Pricing from the left-hand navigation or choose Calculate Pricing from the Credit Risk Pricing widget
From the prompt, proceed using the latest available score or enter the Scoring workflow before reaching the Credit Risk Pricing page

Continuity for Transfer Pricing Across Credit Risk Pricing Methodologies
GSAC v3 now serves as the primary analytical surface for Credit Risk Pricing in the updated experience. For back‑testing, historical comparison, and established transfer pricing analysis, GSAC v2 and CYC methodologies remain accessible through the traditional Credit Risk Pricing interface. This structure separates forward‑looking analysis from historical methodologies while maintaining continuity across workflows.
Find it in the platform:
Search for and select a company in the top search
On the company’s tearsheet, select Credit Risk Pricing from the left-hand navigation or choose Calculate Pricing from the Credit Risk Pricing widget
From the prompt, proceed using the latest available score or enter the Scoring workflow before reaching the Credit Risk Pricing page
Select this link to redirect to the legacy interface, where data from CYC and GSAC v2 remains accessible

Credit Analytics in S&P Capital IQ Plug-In
In this release, we added EWS 1.0 to the S&P Capital IQ Plug‑In, enabling early warning signals for a company’s declining risk level.
Introducing EWS 1.0 in the S&P Capital IQ Plug-In
Users can now access six new EWS metrics in the S&P Capital IQ Plug‑In, helping them identify and predict potential credit risks or defaults before they materialize, and enabling proactive risk mitigation.
New metrics include:
IQ_EWS_SIGNAL
IQ_EWS_DAYS
IQ_EWS_PD_THRESHOLD
IQ_EWS_YOY_PD_CHANGE_PERCENT
IQ_EWS_DIMENSION1_STATUS
IQ_EWS_DIMENSION2_STATUS
Find it in the platform:
In Excel, launch S&P Capital IQ Plug-in and open Formula Builder
Navigate to the Early Warning Signal folder to access the new metrics
Note: These metrics support both prescore and OTF functionality
