- DATE:
- AUTHOR:
- S&P Global
September 2025 S&P Capital IQ Release Notes
S&P Capital IQ Release Highlights
In this release, we added new enhancements on Capital IQ to improve your daily workflows:
We enhanced Portfolio Analytics to enable intuitive visualization of portfolio structures, dynamic evaluation of trade decisions, and streamlined report management, thereby improving efficiency and decision-making.
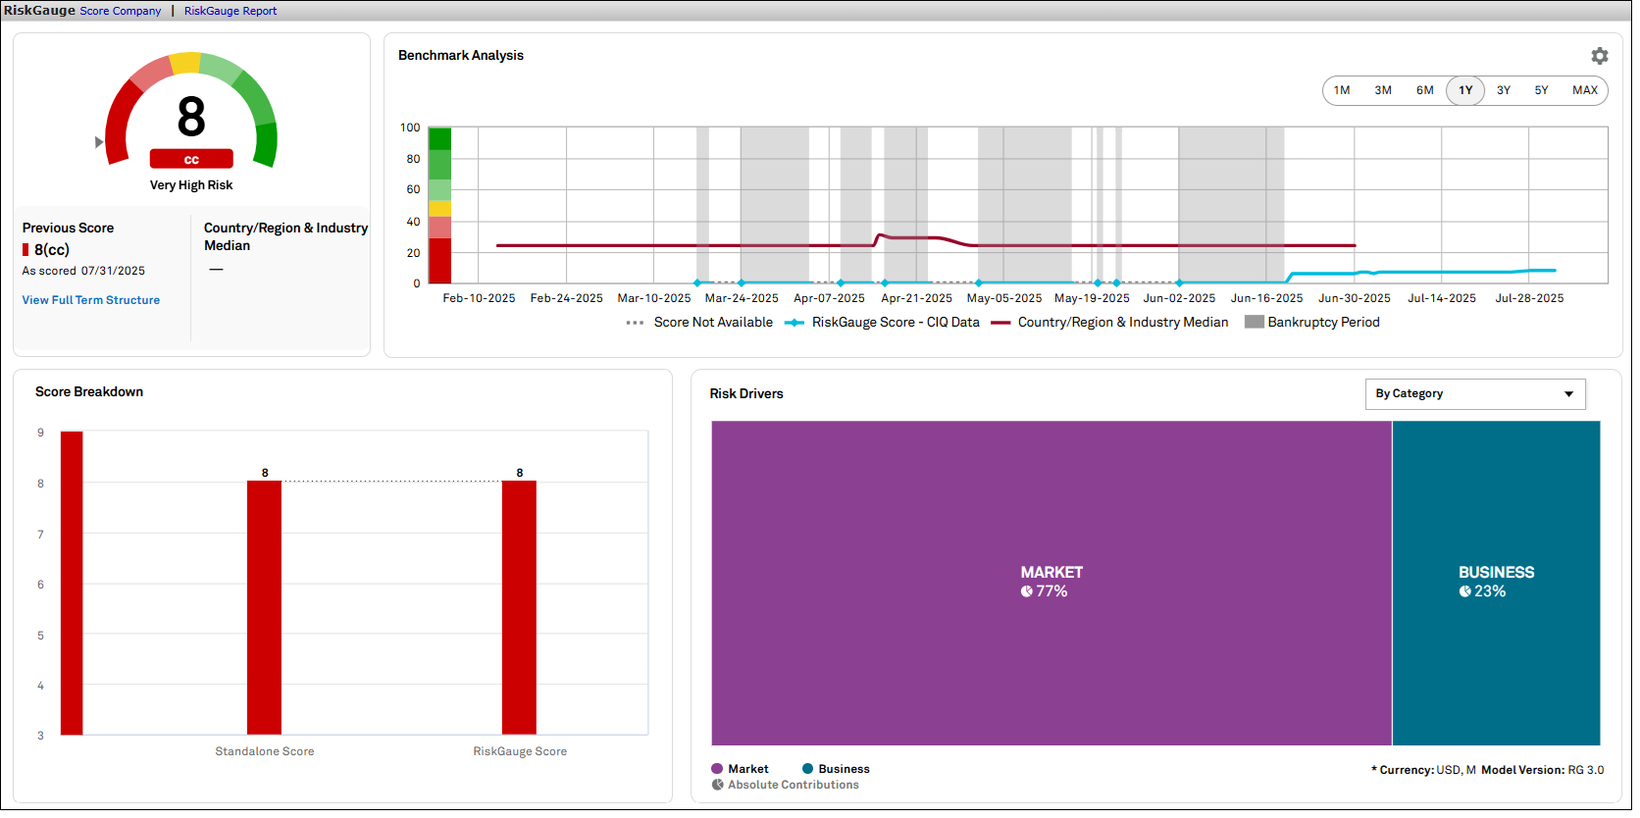
RiskGauge Desktop delivers visibility into default periods and emergence status, enhancing historical performance insights, while supporting user workflows with customizable drivers, financial displays, and preferred currencies.
In Credit Risk Pricing, we expanded access to GSAC v3 Bond Sector curves across global regions and sectors, adding a new field for seniority levels to enhance bond visibility and analysis.
In the S&P Capital IQ Plug-In, we introduced Absolute Contribution Values data items and OTF functionality for RiskGauge 3.0, improved GSAC v3 curve performance for high-volume requests, and added a new seniority parameter for customization.
Visit S&P Capital IQ and Contact Us for additional details.
Portfolio Analytics
In this release, we introduced a Treemap chart visualization that allows users to represent both size and hierarchy in a compact view by mapping metrics to size and color. We also added the capability to simulate trades on the fly and assess their impact through Adjusted Portfolio Comparison. Additionally, we enhanced the Batch Scheduler with customizable report naming.
These enhancements empower users to visualize portfolio structure more intuitively, evaluate trade decisions dynamically, and streamline report management, improving efficiency and decision-making across portfolio analytics workflows.
Treemap Charts
Users can now add Treemap charts to every portfolio report, enhancing their ability to visualize portfolio composition through a hierarchical layout where both size and color are determined by user-defined metrics. Treemap charts facilitate quick identification of dominant positions, exposure concentrations, and relative performance across segments, all within a single, intuitive view. By merging structure and scale into one visualization, users can analyze portfolio dynamics more effectively and uncover insights that may be overlooked in traditional tabular or flat chart formats.
Find it in the platform:
Navigate to the Portfolios tab from the top navigation
Click on Reports and open an existing report or create a new one
Click on the Charts icon in the Widget Library on the right-hand side and select a Treemap chart type
Add two metrics to the widget to define size and color intensity, e.g., Weight and Return
Under the Color Options, choose Color Range to display the cell value in the rendered chart
If grouping levels are applied in the chart, select Single-level vs. Full display options to display all holdings on a single level or use hierarchical drilldown
Click Save and run the report


Adjusted Portfolio Comparison
Users can now simulate buy and sell transactions directly within a report, enabling them to evaluate the impact of potential trades on portfolio risk, performance, characteristics, and composition, without altering the original portfolio. This enhancement allows for on-the-fly scenario analysis, empowering users to make more informed investment decisions, test strategic ideas, and visualize outcomes before committing to changes. If the simulated adjustments produce favorable results, users can save the adjusted portfolio as a new version, or they can choose to discard it.
Find it in the platform:
Navigate to the Portfolios tab from the top navigation
Click on Reports and open an existing report
Expand the dropdown arrow next to the report name and select Adjusted Portfolio Comparison
Choose a portfolio to adjust it with simulated trades
Add transactions to the portfolio and click Save
Notice that the report is now split into two identical copies, with the left side report generated with the original portfolio, and the right side with the adjusted portfolio pre-populated
Click Update
Evaluate the effect of simulated trades on portfolio returns, risk, composition or characteristics
To add temporary transactions, click on the Portfolio Options control next to the adjusted portfolio name and select Edit Portfolio
Click on Save Portfolio to save the adjusted portfolio to your repository
To discard the changes, navigate back to the dropdown arrow next to the report name and select Return to Edit Report


Customizable Batch Scheduler Report Names
Users can define custom filenames for reports generated through the Batch Scheduler, simplifying the process of distinguishing between outputs and avoiding naming collisions. This feature supports both static text and dynamic, parameterized tokens, such as report start and end dates, enabling filenames to reflect the specific context of each scenario. As a result, users benefit from cleaner organization, improved traceability, and streamlined report management in automated workflows.
Find it in the platform:
Navigate to the Portfolios tab from the top navigation
Click on Scheduled Reports and open an existing schedule or create a new one
Go to the Delivery tab and select the Custom Name Pattern checkbox
Click on the information icon to view the list of all possible system parameters that can be included in the custom name
Create a custom name, using required parameters and free text and click Save
Run scheduled report using the Run Now button or wait until the next scheduled instance to view generated reports with custom names

Credit Analytics
In this release, we enhanced the user experience by providing clear visibility into every company's historical and current default period. This information is displayed on the RiskGauge Report, Scoring Results, and various models and widgets within the Tearsheet, ensuring precise and reliable credit risk assessments.
Emergence from Bankruptcy
Users now have clear visibility into every company's historical and current default period. The start of the default period and emergence status are displayed on the RiskGauge Report, Scoring Results, and within the Tearsheet’s Fundamental Probability of Default, Credit Model, Bond Implied Scoring Model, and RiskGauge Widget. Additionally, all scores are accurately displayed based on the bankruptcy transaction status, whether a company is in default or has emerged.
Find it in the platform:
Search for any defaulted or emerged company in the top search
Navigate to the company’s Tearsheet or RiskGauge Report, or the Scoring Company tab under Credit Analytics top navigation
View the Fundamental Probability of Default, Credit Model, Bond Implied Scoring Model and RiskGauge Model to review the changes

RiskGauge Desktop
This release offers RiskGauge Desktop users clear visibility into default periods and emergence status, delivering valuable insights into a company’s historical performance. Additionally, this release focuses on supporting each user’s unique workflow by displaying all RiskGauge drivers in their preferred scale setting, allowing customization of financial value displays, and enabling the use of preferred currencies.
Emergence from Bankruptcy
Users now have clear visibility into every company's historical and current default period. The start of the default period and emergence status are displayed on the Tearsheet’s RiskGauge widget, RiskGauge report, and Scoring results. Additionally, RiskGauge scores are accurately shown based on the bankruptcy transaction status, whether Default or Emerged.
Find it in the platform:
Search for any company that has a historical or current default period in the top search
Navigate to the Tearsheet and check the Credit Analytics widgets
Go to the RiskGauge Report and review the relevant sections
Access the Scoring Results in the Scoring tool for company-specific status and scores

Benchmark and Bond Risk Driver Values
Users can now view Risk Driver values for all benchmarks and Bond Implied Signals according to their preferred RiskGauge scale setting. This enhancement allows users to see these values in their preferred format across various reports and dashboards, including the RiskGauge Dashboard, Tearsheet, Scoring workflow, and Company Comparer. This update is available exclusively on RiskGauge 3.0.
Find it in the platform:
Search for any company with a Benchmark or a Bond Implied Signal in their RiskGauge Score
Navigate to the Credit Risk Dashboard, Tearsheet, RiskGauge Report, Scoring Results page, or the Company Comparer for the selected company
View the Risk Drivers section within the RiskGauge widget


Customized Decimal Place Settings
Users can now customize the display of financial values across all widgets in the RiskGauge Report Viewer by selecting the number of decimal places (from 0 to 6) in their Credit Analytics setting preferences. This enhancement allows for a tailored and precise presentation of financial data, catering to individual user needs.
Find it in the platform:
Navigate to My Capital IQ > Settings > Formatting > Decimal Places and select the required option in the dropdown menu
Navigate to the RiskGauge Report Search and search for any company
Launch the RiskGauge Report Viewer by clicking View or PDF
View the preferred decimal places for financial values across all widgets

User Preferred Currency in Company Comparer
Users can enhance their financial analysis in Company Comparer by selecting either the reported currency or a specific currency for viewing financial values. This flexibility allows for a tailored and accurate presentation of financial data to meet individual user preferences.
Find it in the platform:
Navigate to My Capital IQ > Settings > Regional > Currency and select a required option in the dropdown menu
Navigate to the Company Comparer and access financial values reported in the selected currency

Credit Risk Pricing
In this release, we expanded access to a broader market by offering GSAC v3 Bond Sector curves across various global regions and sectors. This includes a new field that indicates the seniority level used to generate each curve, providing full visibility into the bonds considered and ensuring a more comprehensive and informed analysis.
Enhanced Curve Retrieval and Addition of Seniority in Parameters
GSAC v3 Bond Sector curves now offer comprehensive coverage across global regions and sectors, enhancing access to market insights. This enhancement introduces a new field that indicates the seniority level used to generate each curve, categorized as Senior Secured, Senior Unsecured, or Subordinated, providing complete visibility into the nature of the bonds considered. Furthermore, the transparency section now indicates that bonds are selected according to the seniority of the generated curve, ensuring a more thorough and informed analysis.
Find it in the platform:
Navigate to Credit Risk Pricing from the top navigation or left links on a company profile, or click on the Calculate Pricing option within the Credit Risk Pricing widget on a company's Tearsheet
After adding the necessary scoring inputs, proceed to the final step of Credit Risk Pricing to find the new Seniority parameter under Display Options
Select a specific senior to access the global GSAC v3 Bond curves
Note that while global curves are available for various seniorities, the option “All” is not included

S&P Capital IQ Plug-In
In this release, we introduced Absolute Contribution Values data items and OTF functionality for RiskGauge 3.0. Additionally, we enhanced the GSAC v3 curves performance by enabling high-volume requests in the Capital IQ Plug-in and introduced a new seniority parameter for customization.
Introducing Absolute Contribution Values to RiskGauge 3.0
Users can now access Absolute Contribution Values data items, which provide essential insights into risk drivers. To enhance the utility of these metrics, financial ratio values are included to help users gain a comprehensive understanding, since absolute contribution values alone may not offer a complete perspective.
In total, 71 new metrics are added to the Absolute Contribution/Risk Driver folder under RiskGauge 3.0. This expansion enables users to analyze risk more effectively and make informed decisions based on a broader range of data.
Find it in the platform:
In Excel, launch S&P Capital IQ Plug-in and open the Formula Builder
Under Data Items, navigate to the RiskGauge 3.0 folder to find the metrics organized into three subfolders: Prescore, Benchmark, and Absolute Contribution
Open the Absolute Contribution folder to access the new data items

On-the-Fly Functionality for RiskGauge 3.0 in Capital IQ Plug-in
Users can now leverage on-the-fly functionality for RiskGauge 3.0 metrics in Capital IQ Plug-in. This feature allows users to input their parameters directly, generating a score based on their inputs and facilitating a more customized analysis of risk. Users can now retrieve both financial and non-financial data for a combination of company type, country, and industry.
NMV Metrics for On-the-Fly:
NMV METRICS - FINANCIALS
o IQ_RG3_FINANCIAL_INPUT_MNEMONIC
o IQ_RG3_FINANCIAL_INPUT_NAME
o IQ_RG3_FINANCIAL_INPUT_VALUE
NMV METRICS – NON-FINANCIALS
o IQ_RG3_NON_FINANCIAL_INPUT_MNEMONIC
o IQ_RG3_ NON_FINANCIAL_INPUT_NAME
o IQ_RG3_ NON_FINANCIAL_INPUT_VALUE
Performance Enhancement to GSAC V3 curves and introducing Seniority Input Parameter
Users can experience significant performance improvements to the GSAC V3 curves within the Capital IQ Plug-In. They can execute high-volume requests seamlessly, processing multiple requests in a single template without interruptions.
We have introduced a new input parameter for Seniority, enabling users to customize curve generation by incorporating seniority into their analysis. This addition allows for deeper insights and tailored models to better meet specific needs.
