- DATE:
- AUTHOR:
- S&P Global
September 2024 S&P Capital IQ Release Notes
S&P Capital IQ Release Highlights
In this release, we enhanced Portfolio Analytics Batch Scheduler, improved custom grouping, and enabled security value reviews across all reporting subperiods. We launched Bond Implied Scoring model in Credit Analytics and introduced key updates to the Project Finance Scorecard. Additionally, we improved ProSpread, with significant user experience and added flexibility for financial data spreading.
Visit S&P Capital IQ and Contact Us for additional details.
Portfolio Analytics
In this release, we enhanced the functionality of the Batch Scheduler, improved user experience with reusable custom grouping and an ability to quickly review security values in any of the reporting subperiods, regardless of security inclusion or exclusion in a portfolio at a given time.
Optional Schedule-wide Custom Pricing Source
Users can now apply custom or default pricing source to all layouts within the schedule when applicable.
Find it in the platform:
Navigate to Portfolios in the top navigation and select Schedules
Create a new schedule or edit an existing one
Click on Options next to the schedule name
Select Apply pricing options to all reports in the schedule checkbox
Set up a Pricing Source scheme
Save the edited schedule
All generated reports will automatically have the same pricing option applied

Duplicating an Existing Schedule
Users can copy a scheduled report, customize it and save it as a new version, allowing for duplication and quick editing of schedules that require only a few modifications in the selections.
Find it in the platform:
Navigate to Portfolios in the top navigation and select Schedules
Go to Saved Schedules and find the schedule to copy
Right-click on the three-dot icon to the left of the schedule’s name
Select Save As and make desired changes to the schedule
Enter a new name and click Save

Reusable Custom Grouping
Users can now create and save groupings to the Custom Groupings library and apply them to any table or chart. This makes it easy to reuse commonly saved groupings across widget reports or share them with others in the company.
Find it in the platform:
Navigate to Portfolios in the top navigation and select Reports
Click on Grouping > Select Grouping
In the selected grouping, click on the icon to the far right of the grouping name and select Save As
Enter a name to the new grouping and click Save
Choose whether the grouping will be accessible only to the user or shared firm-wide
Click Save
Users can find saved groupings when adding a grouping to the Global bar or a widget-specific grouping by navigating to the Saved Groupings folder


Instant Run Option for New Schedules
Users can now trigger the schedule at any time, including immediately after creation, by clicking the newly introduced ‘Run Now’ button.
Find it in the platform:
Navigate to Portfolios in the top navigation and select Schedules
Go to Saved Schedules
Click on the Run Now arrow button to the right of the Recurrence column
The schedule will be queued to run immediately


View Security Data for All Dates
Users can view all associated numeric metrics for portfolio securities, regardless of their inclusion in the portfolio on a given date, to evaluate all holdings’ data side by side when applicable. Users can choose to display metrics for securities that were not in the portfolio during any of the subperiods.
Find it in the platform:
Navigate to Portfolios in the top navigation and select Reports
Select a report, edit or add a table widget
Add or edit metrics
Click on Include All Values checkbox for the metrics that should display value regardless of the holding’s inclusion in the portfolio during the time frame
For metrics where this selection is applied, portfolio-level aggregation will default to None
Save and Run the report

Credit Analytics
In this release, we launched the Bond Implied Scoring model, focusing on advanced analytics. Additionally, we added VAT ID as an identifier for all applicable Credit Analytics mnemonics within the S&P Capital IQ Plug-in.
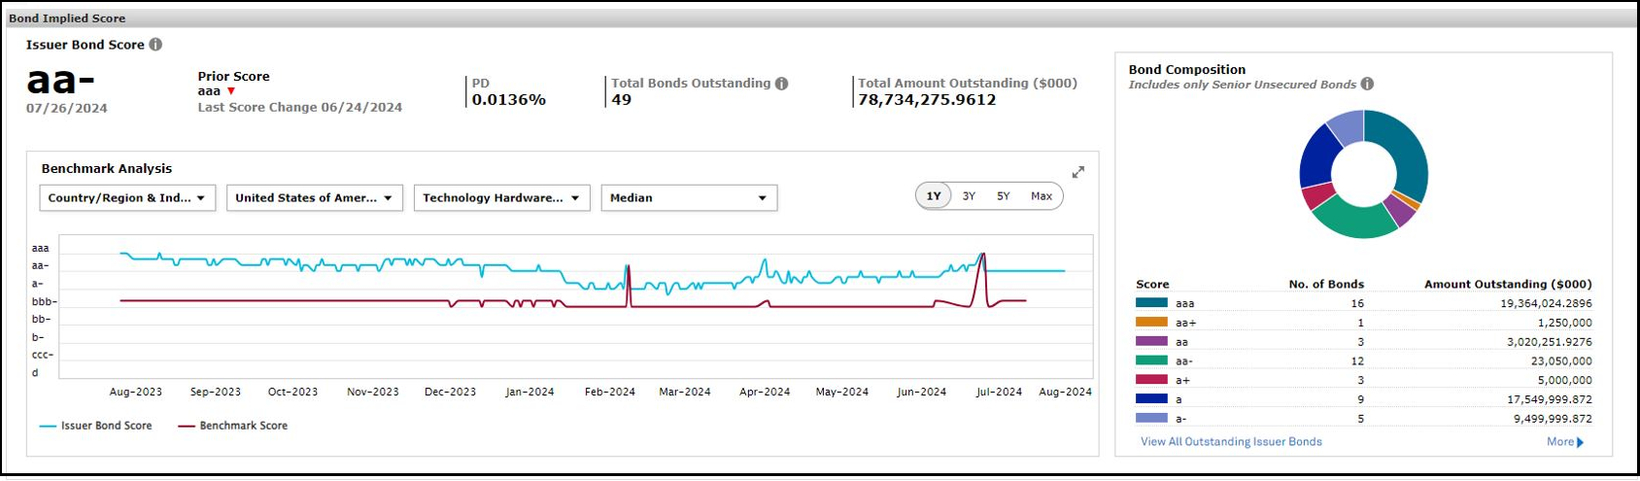
Bond Implied Scoring (BIS)
Users gain the ability to extract insights from the bond market using Bond Implied Scoring, a measure of credit risk to evaluate corporate bond issuers. The model scores both Issuers, and their relevant outstanding senior unsecured bonds by benchmarking bond spreads against adjusted sector curve data on a weekly basis.
For methodology details, please refer to the Bond Implied Scoring Model Whitepaper on the S&P website and Capital IQ platform.
Find it in the platform:
Search for a company from the top search bar
Navigate to the company’s tearsheet, any company with a Bond Implied Score will display the widget
Navigate to the company’s RiskGauge Report by either clicking on the RiskGauge Report badge or the name of the company in the RiskGauge Report section
On the report, any company with a Bond Implied Score will display the widget
Coverage stats:
Covers Corporate Senior Unsecured Bonds issued by both rated & unrated entities across all major regions: North America, Europe, and Asia Pacific.
Applicable to Senior Unsecured Bond issues which are denominated in USD, EUR, GBP, CAD, AUD, CHF, NZD, JPY, SGD

VAT ID Support in S&P Capital IQ Plug-in
Users can now incorporate VAT ID as an identifier in the S&P Capital IQ Plug-in formula builder to retrieve the metric results. Using the Identifier lookup search function, users can also search for companies based on their VAT ID.
Find it in the platform:
Launch S&P Capital IQ Plug-in and open Formula Builder
Enter VAT ID as an identifier in the Formula Builder to retrieve the metric results by inserting it in the format VAT_#, e.g., VAT_1929201612
Open Identifier Lookup and use the search function to find companies based on their VAT ID (e.g., 1929201612), making it easier to find relevant results.
Scorecards
In this release, we introduced several key enhancements to the Project Finance Scorecard web application. Users can now utilize overlay models within the Probability of Default (PD) assessment, access visual representations of historical assessment scores through time-series graphs, and export their portfolio of assessments to Excel.
Overlay support for the Project Finance Scorecard
Users can access the S&P overlay models for Government-related Entity (GRE) support, sovereign intervention, and T&C assessment directly within the Project Finance Scorecard web application. This allows users to calculate these overlays while completing the PD assessment.
Find it in the platform:
Navigate to the Project Finance application from the Scorecards menu item on the top bar
Start an assessment in a new or existing Project and complete it till step 4
Step 4 will have a section for overlays where users can either define overlays manually or calculate the overlays by providing inputs for the models

Trend Chart for Historical Assessments
The web application now includes a visual representation of historical assessment scores as a time-series graph for each project. This feature enhances users' ability to analyze trends and provides a comprehensive view of a project's performance.
Find it in the platform:
Navigate to the Project Finance application from the Scorecards menu item on the top bar
View the Historical Assessment graph for projects containing approved assessments by clicking the chart icon under the Actions column of the project list

Portfolio Export as Excel
The new portfolio export functionality will allow users to export all assessments under their portfolio of projects into Excel. Users can export this data with or without the user notes provided on individual fields in the assessments.
Find it in the platform:
Navigate to the Project Finance application from the Scorecards menu item on the top bar
Select the Export option at the top right of the landing page above the project list

ProSpread
In this release, we improved ProSpread, officially released in June 2024, with significant enhancements designed to improve user experience and provide additional flexibility for financial data spreading. These updates aim to give users a more flexible and efficient way to work with extracted financial data, offering improved tools for data editing, validation, and usage.
Excel-like Interface
Users can now benefit from more flexibility when working with extracted data tables on ProSpread, closer to a familiar Excel-like experience. The data grid now supports inserting new rows and editing extracted data through cut, copy, paste, and multi-selection capabilities. Additionally, users can export extracted data tables directly into an Excel file to perform additional analysis beyond the financials spread using ProSpread.
Find it in the platform:
Navigate to ProSpread from the menu item on the top bar
Start a new extraction and continue to Step 3 of the process
The data grid in Step 3 supports Excel-like functionalities, and the Export option on the top-right can download extracted data


Auto-sum and Balancing of Extracted Financials
Users can utilize English verification for native language features to verify data item assignments in documents reported in non-English languages. The flexibility to view the list of S&P data items in English provides this.
Find it in the platform:
Navigate to ProSpread from the menu item on the top bar
Start a new extraction and continue to Step 3 of the process
On the top left, find a toggle for English and Default
Turn the toggle to English and view the assigned data item column in the data grid, displaying data in English


English Verification for Native Language Documents
Users can utilize English verification for native language features to verify data item assignments in documents reported in non-English languages. The flexibility to view the list of S&P data items in English provides this.
Find it in the platform:
Navigate to ProSpread from the menu item on the top bar
Start a new extraction and continue to Step 3 of the process
On the top left, find a toggle for English and Default
Turn the toggle to English and view the assigned data item column in the data grid, displaying data in English

RiskGauge Desktop
In this release, we enhanced the user experience by enabling users to select their preferred RiskGauge Score scale settings, seamlessly spread a company’s financials, and then score the company. Additionally, the Company Comparer has increased coverage by about 2,000 companies, including companies in the Insurance industry.
RiskGauge Score Scale Settings
RiskGauge desktop users can customize their entire experience by selecting preferred RiskGauge score scale—Probability of Default (PD)%, 1-100, or letter grade—aaa to d.
Find it in the platform:
Navigate to the Capital IQ Settings page from the top navigation menu
On Settings, click on Credit Analytics and change Primary Score in the RiskGauge section

Peer Comparison for Insurance Companies
Users can utilize the Company Comparer to compare insurance companies with their peers, quickly viewing each company's RiskGauge Score and drivers included in the peer comparison.
Find it in the platform:
Search for any Insurance company from the top search bar
Navigate to Company Comparer from the left-hand navigation menu
Or on the Analyzer grid, click Company Comparison from the action menu
Coverage stats:
Companies with a RiskGauge score from the Insurance industry, amounting to approximately ~2000.

Score Company after spreading Financials with ProSpread
Users can spread company financials using ProSpread and seamlessly navigate to Score Company within a single workflow.
Find it in the platform:
Navigate to ProSpread from the top navigation menu, provide company information, upload the financial statement, and complete the extraction & verification process
On Step 4 of the ProSpread workflow, assign a currency and provide period & year for extracted financials
Score button on top of the page will be enabled
Click Score to navigate to the new Scoring User interface to score extracted financials, which will be preloaded in the SUI
