- DATE:
- AUTHOR:
- S&P Global
March 2024 S&P Capital IQ Release Notes
S&P Capital IQ Release Highlights
In this release, we enhanced Portfolio Analytics by introducing support for private companies as an asset class and upgraded our report publishing capabilities by providing a mechanism for converting numeric values to their textual equivalents. Additionally, in Credit Analytics, we expanded our Credit Risk Pricing by integrating GSAC Bond Pricing and updated our Macro Scenario Analysis.
Visit S&P Capital IQ and Contact Us for additional details.
Portfolio Analytics
In this release, we expanded Portfolio Analysis coverage by enhancing support for private companies, enabling users to upload these companies directly, group them as an asset type and exclude private company holdings from analysis, as required. We have further enhanced report publishing capabilities by providing a mechanism for converting numeric values to their textual equivalents, which supports tagging and enhances reporting clarity.
Upload Portfolios with Private Company Holdings
Users can now upload portfolios with private company holdings via Portfolio Dashboard. Portfolios with private holdings can be uploaded by copying and pasting the holdings list or uploading a file containing portfolio constituents, including private companies.
Find it in the platform:
Navigate to Portfolios tab and select Portfolio Dashboard or Portfolios Management
Click Create Portfolio in the upper right
Provide portfolio metadata fields and select Upload By > By Static Weight if your portfolio contains private company holdings
Enter portfolio’s market value and Save portfolio
Once portfolio is created, click on Update Holdings on the upper right
Click Download Static Weights template to ensure your portfolio file format meets the requirements
Click Next and upload a file by clicking Select A File From Your Computer
Upload the file with portfolio holdings
When Import dialog is populated with portfolio holdings, ensure all fields are mapped correctly
For private companies, select Private Company Name for the first column
Ensure that the holdings' weights add up to 100% and click Upload

Grouping and Exclusions for Private Company Holdings
Users can group private companies as a specific asset class within portfolios containing such holdings. They can segment their private company holdings as a group and exclude all or specific private companies from analysis, as required.
Find it in the platform:
Create a new Portfolio Analytics report or load an existing report and group by Asset Class where one of the supported classes is private company
Navigate to Group By field in the global bar and click Edit
In the Data Library dialog, navigate to Portfolio Data > Portfolio Data subfolder
Select Asset Class and click Add
Select the rest of the report parameters and click Run
Portfolio holdings will be grouped by asset class, with private company holdings in a group of their own, other asset classes being Equity or Fixed Income
To exclude one or more private companies from the analysis, click Options
Click Manage Exclusions
Navigate to the Companies tab and exclude Private Company Type to exclude all private company holdings
Or search for and add individual holdings to the Exclusions list in the same dialog box
Click Save and Run the report

Converting Numeric Values to Text Equivalents in a Report
Users can apply formatting to convert numerical data into textual strings within reports, enabling metric tagging with textual labels or displaying numeric values as text when applicable. This approach is recommended when textual representation provides more clarity to the content of analysis and the most common use applies to custom formulas.
Find it in the platform:
Create a new formula or use an existing formula
After formula structure and content is determined, click Next in bottom right, and Apply Formatting
Create logic-based rules for the text equivalents of the numeric values, and Save
When you run a report with this formula, all reports will display the textual equivalents of the numeric values
For metrics where both numeric and textual data should be displayed side by side, create a copy of a formula and apply text-based formatting to the copy

Credit Analytics
In this release, we expanded our Credit Risk Pricing offering to include GSAC (Government, Sovereign, Agency and Corporate) Bond Pricing data with additional currencies and sectors as well as an update to the Macro Scenario Analysis to enhance clarity around forecasted PD Terms.
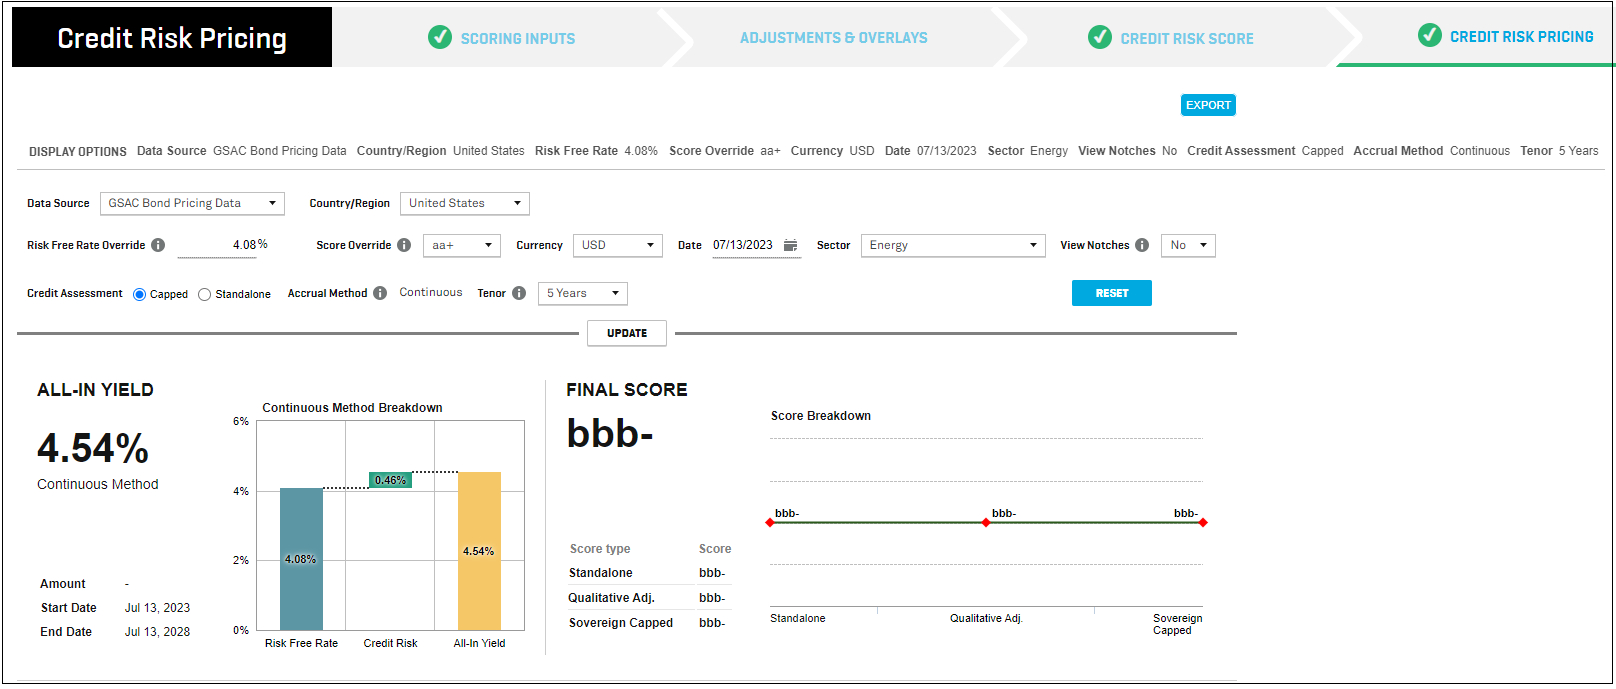
Additional Bond Yield Curves in Credit Risk Pricing
In Credit Risk Pricing, users now have additional yield curves derived from GSAC Bond Pricing data, which provides additional currencies and sectors in the Credit Risk Pricing analysis. The currencies available are JPY, USD, EUR, GBP, AUD, CNY, SGD, HKD, TWD, MYR, DKK, NZD, CHF, CAD, CNH, SEK. Additionally, the sector choice for these yield curves is

Basic Materials, Consumer Goods, Consumer Services, Financials, Government, Healthcare, Industrials, Technology, Telecommunications Services, and Utilities.
Find it in the platform:
Navigate to Credit Risk Pricing from the top navigation bar or in the left-hand navigation
Complete the scoring workflow and click on the Credit Risk Pricing button to land on the final step, Credit Risk Score section
Select the data source as GSAC Bond Pricing Data and update preferred filters, like currency and sector
Click Update to see the additional Yield Curves

Forecast PDs using Macro Scenario Stress Testing
Users can now forecast PDs greater than one year into the future, using ECR Scenarios and compare scenario results by accessing the comparable 1 Year PD of the future forecasted year. Additionally, the term structure will show the cumulative PD starting from the current year and includes both the monthly and yearly term structure.
Find it in the platform:
Navigate to Macro Scenario Analysis through Score Company or directly via the top navigation bar or left-hand navigation
Click ECR Historical Scenarios and select up to 5 scenarios in the pop-up
Choose an ECR Reference Period for a future year to forecast the PD using the predefined forecasted macro factors for the selected ECR Scenarios, and click Ok
Once selected, assign weights and click Generate Score to view forecasted 1 YR PD for the selected future year reference period
For each scenario, click View Full Term Structure to view the cumulative PDs over the entire term
Once scored, upload the scenarios, after which the weighted ECR scenarios are displayed in the Macro Scenario widget on both the Tearsheet and RiskGauge Report

S&P Capital IQ Plug-in
In this release, we have added below new Excel template to meet your data analysis needs.
Excel Template Library
RG Batch Scoring Builder
Helps in compiling the required information in the correct format and generates the CSV file for Batch Scoring with the Credit Analytics’ RiskGauge model. The generated CSV file can be uploaded directly when adding a batch into the Batch Scoring module on the S&P Capital IQ Platform.