- DATE:
- AUTHOR:
- S&P Global
December 2024 S&P Capital IQ Release Notes
S&P Capital IQ Release Highlights
In this release, we added new enhancements on Capital IQ to improve your daily workflows:
We enhanced the Portfolio Analytics suite with scheduler improvements for better flexibility in report management and new reporting tool functionalities for deeper portfolio insights.
We introduced targeted alerts in RiskGauge Desktop to help users monitor credit risk changes and take informed decisions.
We enhanced Credit Risk Pricing with GSAC Bond Sector Curves for accurate market reflection, alignment with GICS, and greater transparency to support users' pricing and regulatory needs.
We launched a beta version of the General Corporate Scorecard, and enhanced the Project Finance Scorecard to incorporate ESG factors in Probability of Default assessments.
We enhanced the Excel-like interface in ProSpread for a seamless financial onboarding experience, offering features like Excel data export, synthetic merged periods, streamlined data selection, easier value updates, and flexible ratio calculations.
Visit S&P Capital IQ and Contact Us for additional details.
Portfolio Analytics
In this release, we enhanced user experience and analytical capabilities within the Portfolio Analytics suite. We added numerous enhancements to the scheduler, providing clients with greater flexibility and transparency in managing scheduled reports. Additionally, we introduced new functionalities in the Portfolio Analytics reporting tool, enabling clients to delve deeper into their portfolio holdings and assess overall exposure to specific securities across their entire portfolio universe.
7-Year and 10-Year Rolling Periods in Scheduler
Users can now choose a rolling 7-year or 10-year period timeframe option within the Portfolio Analytics Scheduler. This enhancement enables clients to schedule recurring reports using a 7-year or 10-year timeframe, with delivery options available via email or FTP.
Find it in the platform:
Navigate to the Portfolios tab from the top navigation menu
Click on Schedules, and select Create New Schedule
Choose your desired timeframe 7 years or 10 years

View all Associated Jobs in Scheduler
Users can now search for any portfolio, benchmark, index, or fund to view all scheduled reports associated with a specific entity. This provides complete transparency into reports that may be impacted by changes to the searched entity.
Find it in the platform:
Navigate to the Portfolios tab from the top navigation menu
Click on Schedules, and select Find in Schedules
A dialog will appear displaying a list of recent portfolios
Use the search bar to look for a specific Portfolio or Index, or Fund to view a complete list of matching schedules

Total Exposure of Securities
Users can now access the total exposure (weight) of a specific security across all their portfolio holdings within a Portfolio Analytics report. This feature enhances transparency regarding their allocation to specific security as a constituent across every portfolio while also calculating the total exposure across all portfolios. For instance, if a user holds AAPL in seven different strategies or portfolios, they can quickly and easily view the weight of AAPL in each portfolio and its overall weight across their entire portfolio book.
Find it in the platform:
Navigate to the Portfolio Analytics report page and open an existing or create a new report
The Exposure sidebar opens as a new table within the Portfolio Analytics report
Build a report containing a table, then click the three-dot menu to the left of a specific security of interest
Select View Exposure and the exposure sidebar will be displayed in the report
Toggle between the pre-defined dates and currencies, and the table will display each portfolio that includes the security
It will display Shares Held, Market Value of each position, Total Portfolio Market Value and the Weight of the security within each portfolio as well as the Aggregate Weight across all portfolios

Drilldown Option in Time-series Bar Chart
Users can now have enhanced transparency in their portfolio holdings with a drill-down feature in the time series and stacked bar charts within Portfolio Analytics. They can toggle between multiple view modes, and analyze individual groupings or securities and metrics across different time horizons. This added granularity provides users with greater flexibility to view and analyze different aspects of their selected portfolio.
Find it in the platform:
Navigate to the Portfolio Analytics report page and open an existing or create a new report
Add a bar chart or stacked bar chart to the report
Select multi-period within the Widget Options and Save the table
Click the gear icon on the left side of the chart. View Mode will appear with a toggle option between the groupings
Search or select a security within the pre-defined groupings
The chart will display details at the grouping or security level over the defined timeframes


RiskGauge Desktop
In this release, we added targeted alerts focusing on user-defined criteria to help users stay on top of credit risk changes. These alerts provide precise information on key areas of concern, ensuring that users do not miss critical shifts in credit risk and can make informed decisions swiftly and confidently.
RiskGauge and Early Warning Signal Alerts
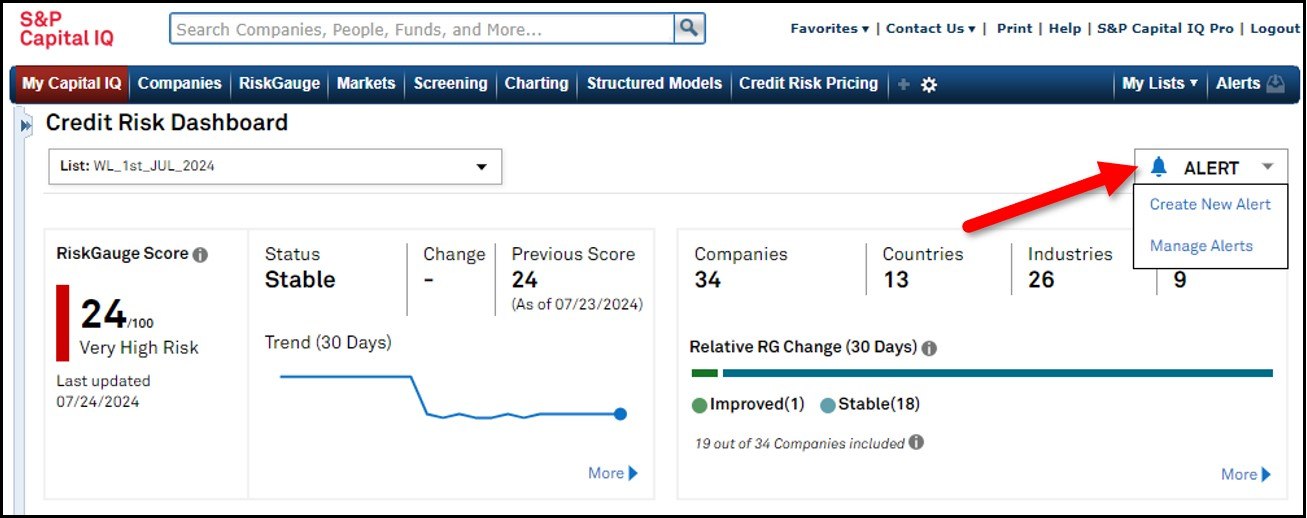
Users can now set alerts to be notified of any changes in the RiskGauge Score or Early Warning Signal across a whole portfolio or on an individual company basis. These alerts can be customized to the user’s preference notifying them via email as soon as changes occur in their counterparties' credit risk.
Find it in the platform:
Navigate to Credit Risk Dashboard from the RiskGauge tab on the top navigation
Click on the Alert option on the top right
Select Create New Alert or Manage Alerts
To set an alert for a specific company, navigate to the company’s Tearsheet and click on the RiskGauge Alert icon from the action menu


Credit Risk Pricing
In this release, we enhanced Government, Supranational, Agency, and Corporate (GSAC) Bond Sector Curves, ensuring an accurate reflection of market factors, a pairing to the Global Industry Classification Standard (GICS), and detailed curve transparency to support our users’ pricing and regulatory needs.
GSAC v3 Bond Sector Curves in Credit Risk Pricing
The GSAC v3 Bond Sector Curves are now available in Credit Risk Pricing, featuring several enhancements to support better decision-making for risk assessments and pricing strategies. We expanded data coverage to 50 countries and regions including Asia Pacific, Eurozone, North America, and Global along with 24 currencies. We also added GICS sector data and all seniorities including Senior Secured, Senior Unsecured, and Subordinate bonds. Additionally, the improved methodology ensures that bond sector curves reflect the true underlying market factors. Finally, we added curve transparency, which displays bonds that exactly match the curve criteria, thereby supporting compliance and regulatory requirements across transfer pricing, valuation processes, and comprehensive credit risk assessments.
Find it in the platform:
Navigate to Credit Risk Pricing from the top menu or left-hand navigation
Complete the Scoring workflow and click the Credit Risk Pricing option
On the page, select GSAC Bond Pricing Data v3 from the Data Source dropdown menu and provide desired values for Currency, Country, Sector
Click Update to view the results
On the Credit Risk Pricing results, view transparency in the Curve Transparency section
In cases where no securities are available in curve transparency, users can click on the Navigate to Screener link to search for securities with similar criteria in the Fixed Income Screener


Scorecards
In this release, we expanded our web-based Scorecards offering with a beta launch of the General Corporate Scorecard on the Capital IQ platform. This Scorecard leverages S&P Ratings’ methodology for credit assessment of corporates, allowing users to seamlessly access and manage their assessments within the Capital IQ platform. Additionally, we enhanced Project Finance Scorecard web application to support environmental, social, and governance (ESG) factors in Probability of Default (PD) assessments.
Beta Release of General Corporate Scorecards
The General Corporate Scorecard on Capital IQ platform enables users to perform assessments by using Capital IQ financials or CreditStats Direct financial sources, or by manually entering data. The solution includes several features to enhance the assessment experience, such as the ability to export outputs to PDF and duplicate assessments. Users will also access a streamlined workflow for reviewing, editing, and approving assessments, simplifying their portfolio management needs.
Find it in the platform:
Navigate to the Scorecards menu item in the top navigation
Select General Corporate from the dropdown menu
Note: Access to General Corporate Scorecards is given to select Capital IQ users with respective entitlements. Please contact your account team for further details.


Project Finance Scorecard with ESG Considerations
Users can now assess the impact of ESG factors on the Probability of Default (PD) of their Project Finance assets, offering a more holistic view of risk.
Find it in the platform:
Navigate to the Scorecards menu item in the top navigation
Select Project Finance from the dropdown menu
On the landing page, start a new assessment for an existing project by clicking the + icon next to the project row or create a new project
In the New Assessment form, select Yes for the Include ESG Considerations? question before beginning the assessment
The Construction Profile and Operations Profile steps of the assessment will include ESG factor dropdowns for relevant questions
ESG considerations can be activated or deactivated at any point during the assessment by using the toggle at the top right on the assessment pages
Note: Access to ESG considerations requires respective entitlements, please contact your account team for details.


ProSpread
In this release, we enhanced the Excel-like interface to closely align with the user’s traditional financial onboarding experience. Users will benefit from flexible features, including Excel export of extracted data and the creation of synthetic merged periods with various types of reporting periods. We made several enhancements to further improve efficiency in achieving a seamless spreading workflow. These include the ability to resize the verification workspace, an improved data item selection process with reordered dropdown options that align with standardized charts of accounts, easier signage update of values, and flexible options for more comprehensive ratio calculations.
Excel-like Interface
The export feature for extracted tables now includes the option to export all tables from the uploaded documents to Excel for further analysis.
Find it in the platform:
Navigate to ProSpread from the top bar menu
Start a new extraction and continue to Step 3 of the process
Export Table now includes the option for Export All Tables to export all the extracted tables to Excel

Period Column Updates
Users can experience enhanced flexibility in working with the value columns for each table. This enhancement provides a clearer view of the table grid, prioritizing columns that are auto-identified as reported financial periods while allowing users to choose and update these periods as needed.
Additionally, users can merge reported periods to create new synthetic periods within ProSpread. This feature is designed to consolidate interim reported periods to create other standard periods, such as Year-to-Date (YTD) or Annual.
Find it in the platform:
Navigate to the ProSpread application from the top bar menu
Start a new extraction and continue to Step 3 of the process
Work with columns marked as periods for better verification of extracted data and confirmation of mappings
Choose from the dropdown to switch between Period Column and All Columns
Select a range of values across two or more columns and combine them to present aggregate values in a newly added column for further spread and analysis


Enhanced User Experience
Users can access several enhancements including improved data item mapping with an updated assigned data item dropdown, resized workspace views in Step 3, better-balancing capabilities with easy assignment updates in Step 4, easy signage values update, and flexible options for comprehensive ratio calculations.
Find it in the platform:
Navigate to the ProSpread application from the top bar menu
Start a new extraction and continue to Step 3 of the process
Hover over the vertical line between the table view grid and the document view to resize the workspace
Expand the assigned data item dropdown and notice the items are now ordered based on their hierarchical relationships rather than alphabetical
Continue to Step 4 of the process
Select multiple values within the table grid and click the Invert Sign to update signage of the values
Click on the Location hyperlink to open the audit window and update the data assignment for the selected location


Ratio Calculation Enhancements
Users can generate a more comprehensive list of ratio outputs with the introduction of the Ratios feature. This new functionality allows users to confirm that all the unavailable ratio components can be ignored, thus assuming a value of 0 for these components for calculating ratios. As a result, users can now auto-calculate a higher number of ratio outputs which significantly improves utility and analysis, reducing the dependency on working with Excel models to calculate them.
Find it in the platform:
Navigate to the ProSpread application from the top bar menu
Start a new extraction and continue to Step 4 of the process
Go over the Ratios tab and click on the checkbox to Use 0 for Null values in calculation
Click on Calculate Ratios to populate ratio output considering 0 for null values in the calculation

Credit Analytics Capital IQ Plug-In
In this release, we introduced two key enhancements to the S&P Capital IQ Plug-In: PIT PD & Term Structure Metrics in RiskGauge and the Bond Implied Scoring (BIS) model metrics. These enhancements strengthen users' analytical capabilities, providing deeper insights into credit risk and bond market dynamics.
PIT PD & Term Structure in RiskGauge
Users can access new PIT and Term Structure metrics to the RiskGauge model on the S&P Capital IQ Plug-In, enhancing their analytical capabilities. The new metrics include Credit Cycle adjusted Probability of Default (PD) and Term Structure metrics.
Find it in the S&P Capital IQ Plug-in:
In Excel, launch the S&P Capital IQ Plug-in and open Formula Builder
Under Data Items, search for the RG PIT and Term Structure metrics within the designated folder
The following 9 new metrics are added to the RiskGauge Model:
PRESCORE CREDIT CYCLE ADJ PD
IQ_RG_CREDIT_CYCLE_ADJ_PD
IQ_RG_CREDIT_CYCLE_ADJ_ONE_TO_HUNDRED
IQ_RG_CREDIT_CYCLE_ADJ_SCORE
ON-THE-FLY CREDIT CYCLE ADJ PD
IQ_RG_CREDIT_CYCLE_ADJUSTED_PD
IQ_RG_CREDIT_CYCLE_ADJUSTED_ONE_TO_HUNDRED
IQ_RG_CREDIT_CYCLE_ADJUSTED_SCORE
PRESCORE TERM STRUCTURE
IQ_RG_STANDALONE_TERM_PD
IQ_RG_SOV_TERM_PD
IQ_RG_PG_SOV_TERM_PD


Bond Implied Scoring Model for Credit Quality Insights
Users can now access a new Bond Implied Scoring (BIS) model, a bond market-driven credit risk model designed to provide additional credit risk signals extracted from the corporate bond market. This model leverages S&P Global Market Intelligence’s extensive bond pricing and sector curve data to generate bond-implied credit scores, mapped to probabilities of default.
Find it in the S&P Capital IQ Plug-in:
In Excel, launch the S&P Capital IQ Plug-in and open Formula Builder
Under Data Items, search for the metrics within the Bond Model folder
A total of 48 metrics are added across these categories: Bond Model Issue - 19 metrics, Issuer - 15 metrics, and Benchmark - 14 metrics

