- DATE:
- AUTHOR:
- S&P Global
December 2025 S&P Capital IQ Release Notes
S&P Capital IQ Release Highlights
In this release, we added new enhancements on Capital IQ to improve your daily workflows:
Expanded Coverage: Added Franchise Disclosure Documents (FDD) data for ~1,100 companies in the S&P Capital IQ Financials offering, enhancing valuations, benchmarking, and M&A analysis.
Portfolio Analytics: Introduced personal folder organization in Portfolio Analytics, allowing users to autosave reports and maintain a side-by-side comparison view.
Benchmark Insights: Enabled export of benchmark constituents from the RiskGauge Score Distribution widget and benchmark score constituents from the Benchmark Analysis chart in RiskGauge, improving transparency and analysis.
Credit Risk Pricing: Added two aggregated GSAC v3 Bond Sector curves and displayed Marginal and Cumulative Expected Losses for comprehensive risk exposure insights.
S&P Capital IQ Plug-In: Introduced new sectors to the GSAC V3 curve and enhanced RiskGauge 3.0 scoring with new NMV metrics and ScaleType parameter for optimized performance.
Financials
In this release, we expanded coverage of the S&P Capital IQ Financials offering by adding data collected from Franchise Disclosure Documents (FDD) for approximately 1,100 companies. These documents contain comprehensive financial information and can be used for valuations, benchmarking, and M&A analysis.
Franchise Disclosure Documents Financials for US Private Companies
Users can access financials for US private companies sourced from Franchise Disclosure Documents. This coverage expansion includes three years of historical financials for over 1,100 companies. We expect to add approximately 300 additional companies by the end of 2025.
Find it in the platform:
Search for and select a company from the top search and navigate to its Corporate Profile e.g., Chick-fil-A
In the left-hand navigation, expand Financials and select the required tab
Coverage stats:
Three years of historical financials for over 1,100 companies

Portfolio Analytics
In this release, we enhanced usability by introducing personal folder organization for Portfolio Analytics reports and layouts. Users can autosave reports as they are constructed and executed, and save a report in Portfolio Comparison view for a persistent side-by-side analysis.
Personal Folders
Users now have the ability to organize their Portfolio Analytics personal reports and layouts into folders for easier access and better workflow organization.
Find it in the platform:
Navigate to the Portfolios tab from the top navigation
Click the left-hand menu icon next to the desired report or layout name and select Move to Folder
Save the item to an existing folder or create a new one by clicking on New Folder
Ensure the desired folder name is selected and click Save
Use the same dialog box to move items between different folders
Empty folders with no artifacts will not be displayed in the Reports tab, but they will still be available for saving reports or layouts
Additionally, when a report or a layout is open, select the Save or Save As options and choose the desired folder for the current item
For added convenience, the menu next to the report or layout name allows users to move the current item into a different folder
Folders can be deleted; however, to preserve items within the folder, ensure they are moved to the top Report level or to another folder before deleting


Autosave Reports
Users can enable an Autosave report feature to ensure that all reports will be periodically saved while constructing or re-running them before explicitly saving them.
Find it in the platform:
Navigate to the Portfolios tab from the top navigation and go to Reports
Enable the Autosave report feature under the Save menu after opening a report
The report will be periodically saved, generating an interim version named [Autosaved] or Untitled [Autosaved]
Autosaved reports are preserved for 7 days
Users can persist an Autosaved report by performing a Save or Save As action
Autosaved reports can be found in the Auto-Saved Reports tab


Saving Reports in Portfolio Comparison Mode
Users can save a report in Portfolio Comparison view mode, preserving the split version layout and portfolio comparison view side by side.
Find it in the platform:
Navigate to the Portfolios tab from the top navigation
Click on Reports and open an existing report or create a new one
Expand the dropdown arrow next to the report name and select Adjusted Portfolio Comparison
Choose a portfolio and benchmark on the right side of the split view
Click Update
Select Save or Save As, and the report will be saved in split mode, opening in the same mode the next time it is accessed

RiskGauge Desktop
In this release, we added the ability for users to view and export benchmark constituents directly from the RiskGauge Score Distribution widget across all benchmark types and quantiles. This update enhances transparency and supports deeper analysis of benchmark composition.
Enhanced Transparency of Benchmark Scores Through Disclosure of Benchmark Constituents
Users can now gain full visibility into the companies that make up the RiskGauge benchmark score. This added transparency empowers you to validate benchmarks, understand market composition, and make more informed comparisons between the company and its benchmarks. With the ability to view and export benchmark constituents directly from the RiskGauge Score Distribution widget, for all benchmark types and quantiles, users gain actionable intelligence for deeper analysis. Historical data is available for daily benchmark scores dating back to January 1, 2024.
Find it in the platform:
Search for and select any company in the search bar to navigate to the Tearsheet
o Scroll down to the RiskGauge Score Distribution widget
o Click the Benchmark toggle on the top left of the widget
Navigate to the Score Company page from the top navigation > RiskGauge > Score Company, or click the Score Company hyperlink from any credit analytics page
o Proceed with the Scoring workflow and on the Scoring Results page, notice the Benchmark RiskGauge Score Distribution widget

Credit Risk Pricing
In this release, we expanded market visibility and risk insights in Credit Risk Pricing. We enhanced GSAC v3 Bond Sector curves to include two aggregated curves: Corporates and Corporate Non-Financial, improving access to broader market insights. Additionally, Credit Risk Pricing now displays both Marginal and Cumulative Expected Losses, offering a more comprehensive view of multi-year risk exposure.
Corporate & Corporate Non-Financial Sectors in GSAC v3
Users can now select Corporate and Corporate Non-Financial sectors in GSAC v3 Bond Sector curves, unlocking broader sector coverage. This update introduces new options in the Sector dropdown - Corporates and Corporate Non-Financial - when generating GSAC v3 curves.
Find it in the platform:
Navigate to Credit Risk Pricing from the top navigation or left links on a company profile, or click on the Calculate Pricing option within the Credit Risk Pricing widget on a company's Tearsheet
Proceed to the final step of Credit Risk Pricing
In the Sector dropdown, view two new options - Corporate and Corporate Non-Financial

Loss Stats Model displays Cumulative Loss
On Credit Risk Pricing, users can now view the Cumulative Expected Loss across all years up to the nth year in addition to the Marginal Expected Loss for each year, for a more comprehensive and clear view of the timing and magnitude of potential losses. This improvement extends across all pages where the Loss Stats Model is presented, ensuring consistent essential insights for multi-year PD Terms.
Find it in the platform:
Navigate to Credit Risk Pricing from the top navigation or left links on a company profile, or click on the Calculate Pricing option within the Credit Risk Pricing widget on a company's Tearsheet
Under Loss Stats, create either Single or Multiple Exposures, set the PD Term to more than one year, enter the relevant exposure details, and click Save
Click the Generate Score
On the Credit Risk Score page, within the Aggregated Loss Stats widget:
o The Aggregated Expected Loss now reflects the sum of Cumulative Expected Losses across multiple exposures
o If only one exposure is created with a PD Term greater than one year, its Cumulative Expected Loss will be displayed in the widget
For exposures with a PD Term exceeding one year, a new See More hyperlink appears under the Marginal Expected Loss field
Click the See More option to view Marginal Expected Losses across each year of exposure

Credit Analytics
In this release, we introduced Benchmark Transparency in RiskGauge, enabling users to export benchmark score constituents directly from the Benchmark Analysis chart. This enhancement reflects our continued commitment to delivering clarity, control, and actionable intelligence across Credit Analytics. Additionally, Expected Loss calculations now allow multi-year PD terms and display both Marginal and Cumulative Expected Losses, offering a more comprehensive view of multi-year risk exposure across all Loss Stats-enabled modules.
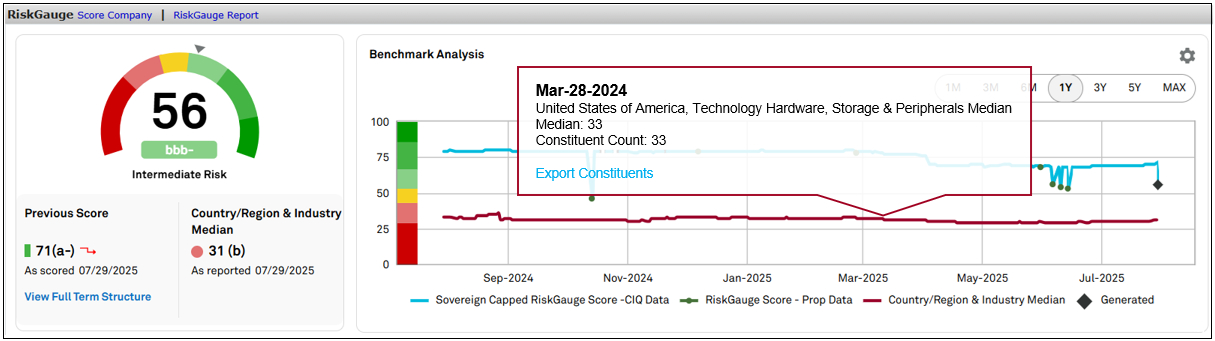
Enhanced Transparency of Benchmark Scores Through Disclosure of Benchmark Constituents
Users can now gain full visibility into the companies that comprise the RiskGauge benchmark score. This added transparency empowers you to validate benchmarks, understand market composition, and make more informed comparisons between the company and its benchmarks. With the ability to view and export benchmark constituents directly from the RiskGauge Benchmark Analysis chart, for all benchmark types and quantiles, users gain actionable intelligence for deeper analysis. Historical data is available for daily benchmark scores dating back to January 1, 2024.
Find it in the platform:
Search for a company in the top search bar
Navigate to the Benchmark Analysis Chart in the RiskGauge widget on Tearsheet or the Score Company page
On the Score Company page, proceed with the Scoring workflow and navigate to the RiskGauge widget on the Scoring Results page
Click on the Benchmark line corresponding to the score date you wish to view for Benchmark constituents
Select the Export Benchmark Constituents from the hover-over tooltip

LossStats supports Expected Loss calculations for Multi-Year PD Terms
Users can now access LossStats, to calculate Expected Loss for PD terms from 1 to 35 years, supporting in-depth long-term counterparty risk analysis with display of both Cumulative Expected Loss across the full term and Marginal Expected Loss for each year. This dual view enables analysts to assess the timing and magnitude of potential losses. This enhancement is consistently applied across all LossStats model-integrated pages, ensuring a unified experience. Together, these updates deliver a more comprehensive framework for evaluating credit exposure.
Find it in the platform:
Search for a company in the top search
Navigate to the Score Company page to begin scoring for the Loss Stats Model
While entering exposure details, notice a new PD Term parameter with selectable values from 1 to 35 years
Under Loss Stats, choose Single or Multiple Exposures, set the PD Term to more than one year, complete the exposure details, and click Save
Click the Generate Score to view results
o Aggregated Expected Loss appears for multiple exposures, showing the sum of all cumulative expected losses
o Cumulative Expected Loss displays total expected loss across the PD Term
o Marginal Expected Loss displays year-specific loss values
If the PD Term is greater than one year, a new See More link will appear under Marginal Expected Loss
Click See More to view a year-over-year graphical breakdown of Marginal Expected Loss
These updates are also reflected on the Tearsheet, RiskGauge Reports, and Credit Risk Dashboard
S&P Capital IQ Plug-in
In this release, we made significant enhancements to the S&P Capital IQ Plug-in, introducing new sectors to the GSAC V3 curve. Additionally, we enhanced the RiskGuage 3.0 scoring functionality by introducing new Name, Mnemonic, Value (NMV) metrics and a new input parameter, ScaleType, designed to improve the user experience and optimize overall performance.
Enhancement to GSAC V3 Curve in S&P Capital IQ Plug-in
Users can now access two new sectors - Corporates and Corporate Non-Financial, in the Sector dropdown within the Formula Builder, enhancing their ability to gain broader market insights.
Find it in the platform:
In Excel, launch the S&P Capital IQ Plug-in and open the Formula Builder
Under Data Items, expand GSAC Curves > Transparency Curve data folder and notice that the Sector dropdown has two additional sectors

Enhanced RiskGauge 3.0 Scoring in S&P Capital IQ Plug-in
Users can access enhanced RiskGauge 3.0 scoring functionality, which now includes 11 new NMV metrics and a ScaleType parameter, giving more granular control and flexibility in evaluating risk, using S&P Capital IQ Plug-in.
IQ_RG3_FINANCIAL_INPUT_FLAG
IQ_RG3_NON_FINANCIAL_INPUT_FLAG
IQ_RG3_MODEL_OUTPUT_MNEMONIC
IQ_RG3_MODEL_OUTPUT_NAME
IQ_RG3_MODEL_OUTPUT_VALUE
IQ_RG3_ABS_CONTRIBUTION_NAME
IQ_RG3_ABS_CONTRIBUTION_MNEMONIC
IQ_RG3_ABS_CONTRIBUTION_VALUE
IQ_RG3_MODEL_RATIO_NAME
IQ_RG3_MODEL_RATIO_MNEMONIC
IQ_RG3_MODEL_RATIO_VALUE
Find it in the platform:
In Excel, launch the S&P Capital IQ Plug-in and open the Formula Builder
Under Data Items, expand the RiskGauge 3.0 > Scores folder to access the new metrics
Notice that a new parameter Scale type, is available
